How-to · Spreadsheet
SUM is not the problem. The five-year Excel workbook is.
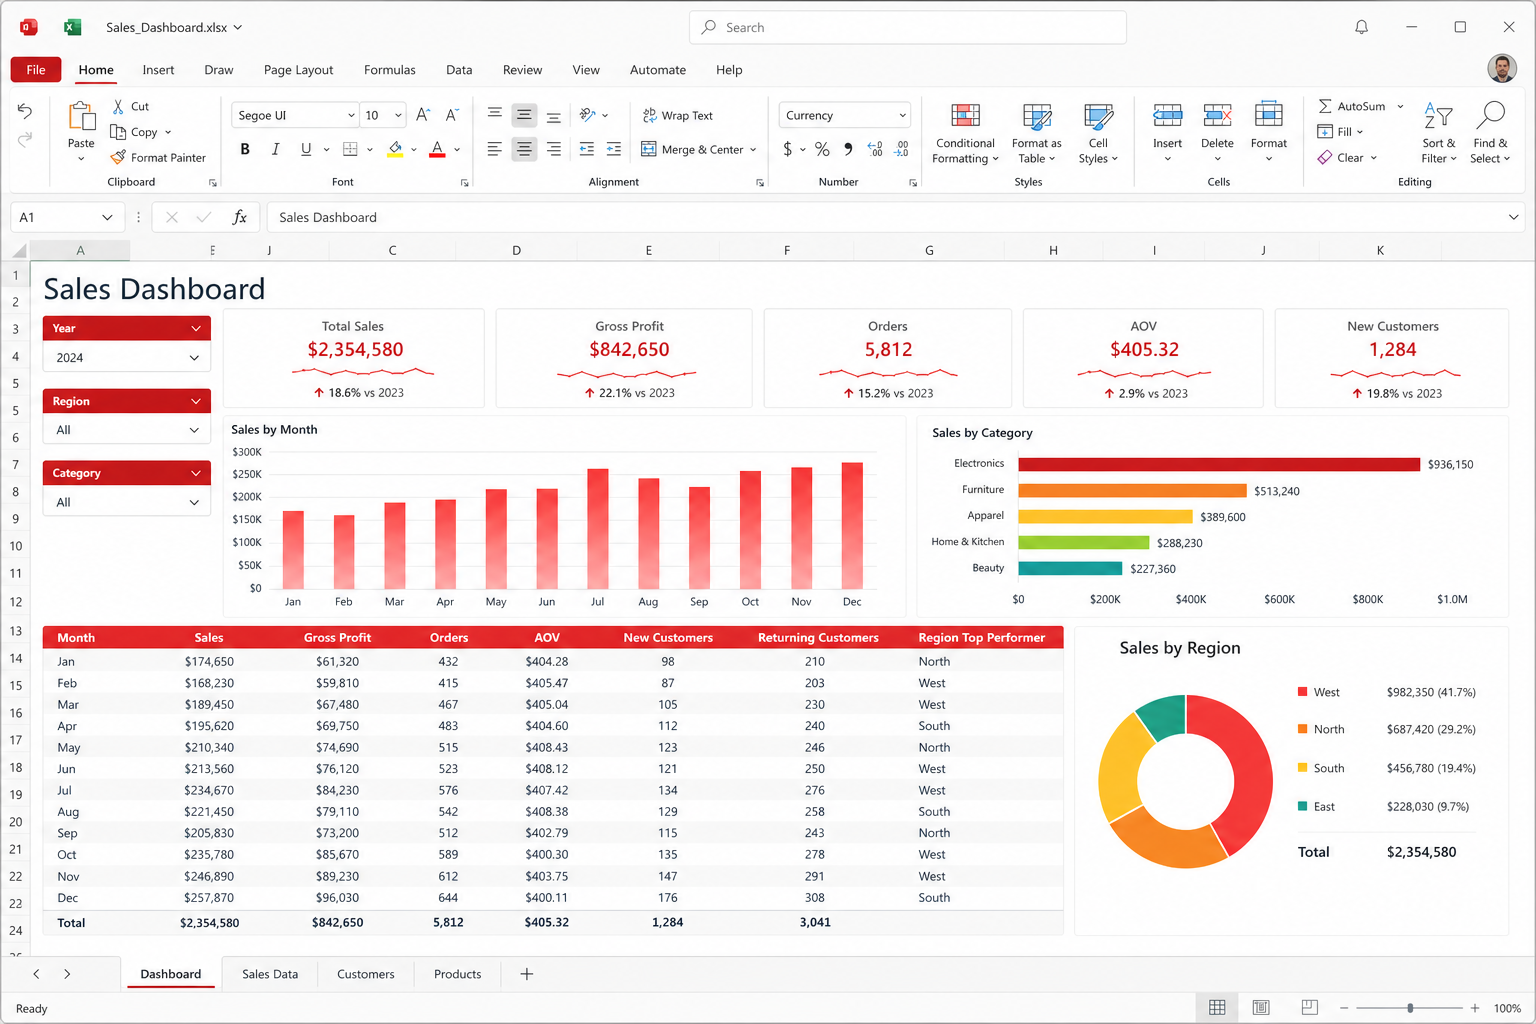
WPS Spreadsheet speaks the Excel you already know for everyday formulas: SUM, IF, VLOOKUP, INDEX/MATCH. Power Query, some dynamic arrays, and VBA are the weaker row. Open a copy, recalculate, and compare a known total before you trust a dashboard at 2 a.m.
What you can type without a new mental model
If you already think in Excel, start the same way: header row, one idea per column, fill down, dollar signs for absolute references. SUM, AVERAGE, COUNT, IF, IFS (when present), VLOOKUP, INDEX plus MATCH, TEXT, DATE, and ordinary arithmetic are the daily language. Named ranges usually behave. AutoFilter and freeze panes are how you live in a 5,000-row export. Charts — column, bar, line, pie, scatter — are good enough for a class report or a shop’s month.
XLOOKUP appears in some builds and not others. If a workbook depends on it, test on your exact version or rewrite as INDEX/MATCH. That rewrite is boring and it travels. The Spreadsheet handbook is the wider map. This page is the formula ritual. Install only from official channels.
VLOOKUP and INDEX/MATCH without folklore
VLOOKUP needs the lookup column on the left of the return column. Approximate match (TRUE or omitted) is how people pick the wrong tax band. Use FALSE for exact match unless you really want a range. INDEX/MATCH is more flexible: MATCH finds the row, INDEX returns the cell. Both patterns are ordinary office work and usually calculate in WPS. Failures that look like “WPS cannot do VLOOKUP” are often unsorted tables, extra spaces in keys, or numbers stored as text.
Trim keys. Do not merge cells in the lookup range. If a #N/A appears, check the key before you blame the host. IFERROR can hide a real problem; use it after you understand the miss, not before.
Where people get hurt
The workbook that grew for five years inside Excel is the risk, not homework SUM. Array formulas, dynamic spilled ranges, Power Query steps, Power Pivot models, and custom number formats tied to a regional setting are the usual blanks. Circular references that rely on Excel iteration settings may sit at a different value. If a bank or a lab would audit the model, keep it on Excel or paste values into a WPS sheet that only reports.
Open those files read-only the first time. Recalculate. Compare a known total. If a dashboard shows blanks where Excel showed numbers, do not “fix” the live file until you have a copy. That sentence is also the analyst composite.
Power Query and VBA are a different product
Power Query (Get & Transform) is Excel’s data hose. WPS Spreadsheet is weaker here. Queries may not refresh, may not exist, or may leave a static cache. Do not retire the Microsoft license because a preview “looked like a table.” VBA macros written for Excel can fail silently, fail halfway, or refuse to run. ActiveX, Outlook automation, and Windows-only API calls are the usual casualties. If the workbook “is the process,” the process stays on Excel. WPS is for reading values and for new sheets you control.
Security: disable macros on email files. A yellow enable bar is a decision. See security and format compatibility.
CSV, locale, and AI
CSV ruins Mondays. If your Windows region uses a comma as a decimal separator, a US export can split columns wrong. Use the text import dialog. Set the delimiter. Prefer ISO dates when you control the export. Never use a sheet as the only copy of a membership list. Export CSV to a folder you back up. Cloud is about 1 GB free — not a warehouse. Sync is optional.
WPS AI can narrate a table and invent a total. Check the cells. Do not paste payroll into a prompt.
Pivots, print areas, and the meeting-room test
Pivot-style summaries exist in WPS Spreadsheet. Treat them as pivot-ish: a simple “sum of sales by month and region” usually works; a cube-like corporate workbook with calculated fields, slicer timelines, and a data model sitting behind six pivots may not. Build the simple summary yourself in a new sheet if the imported pivot cache looks stale. Do not spend the close night clicking Refresh and hoping a Power Query sibling wakes up. That hope belongs on Excel.
Named ranges that refer to another workbook on a network path fail when the path is offline. External links are a compatibility feature and a foot-gun. Break links and paste values when you are handing a file to someone who only has WPS. Charts that use a named range one pixel past the data will plot a zero and look like a bug. Check the source range. 3D charts are decoration; axis titles are the actual communication. Duplicate one clean chart rather than restyling twelve by hand.
Print area, repeating header rows, and “fit to one page wide” decide whether a budget survives a projector. Set them. Then export PDF if the sheet must not be edited in the room. A formula that is correct in the grid and clipped in print is still a failure for the meeting. Large pictures embedded in cells bloat the file the same way they do in Writer; crop first. A dashboard that takes forty seconds to open on a 2 GB laptop is a design problem. See Spreadsheets and export for the freeze.
WPS AI offering to “explain this P&L” will invent a narrative. Read the cells it cites. Daily AI limits apply on paid plans. Do not paste payroll. The AI handbook repeats that because the chat box is convenient at 1 a.m. Convenience is not an audit trail.
Numbered formula steps
- Save as XLSX. One header row. No merged cells in the data block.
- Write SUM and IF on a tiny sample. Fill down. Then add VLOOKUP or INDEX/MATCH with exact match.
- For an Excel-born file, work on a copy. Recalculate. Tick a total you already know.
- If Power Query or dynamic arrays misbehave, stop editing. Keep the model on Excel or paste values.
- If the file is XLSM, read-only in WPS. Do not enable macros from strangers.
- Import CSV with explicit delimiters. Check whether “numbers” are text.
- Print preview or export PDF before a meeting. Fit to page is a formula’s last enemy.
Related: mail merge (clean columns first), Spreadsheets, troubleshooting, download.